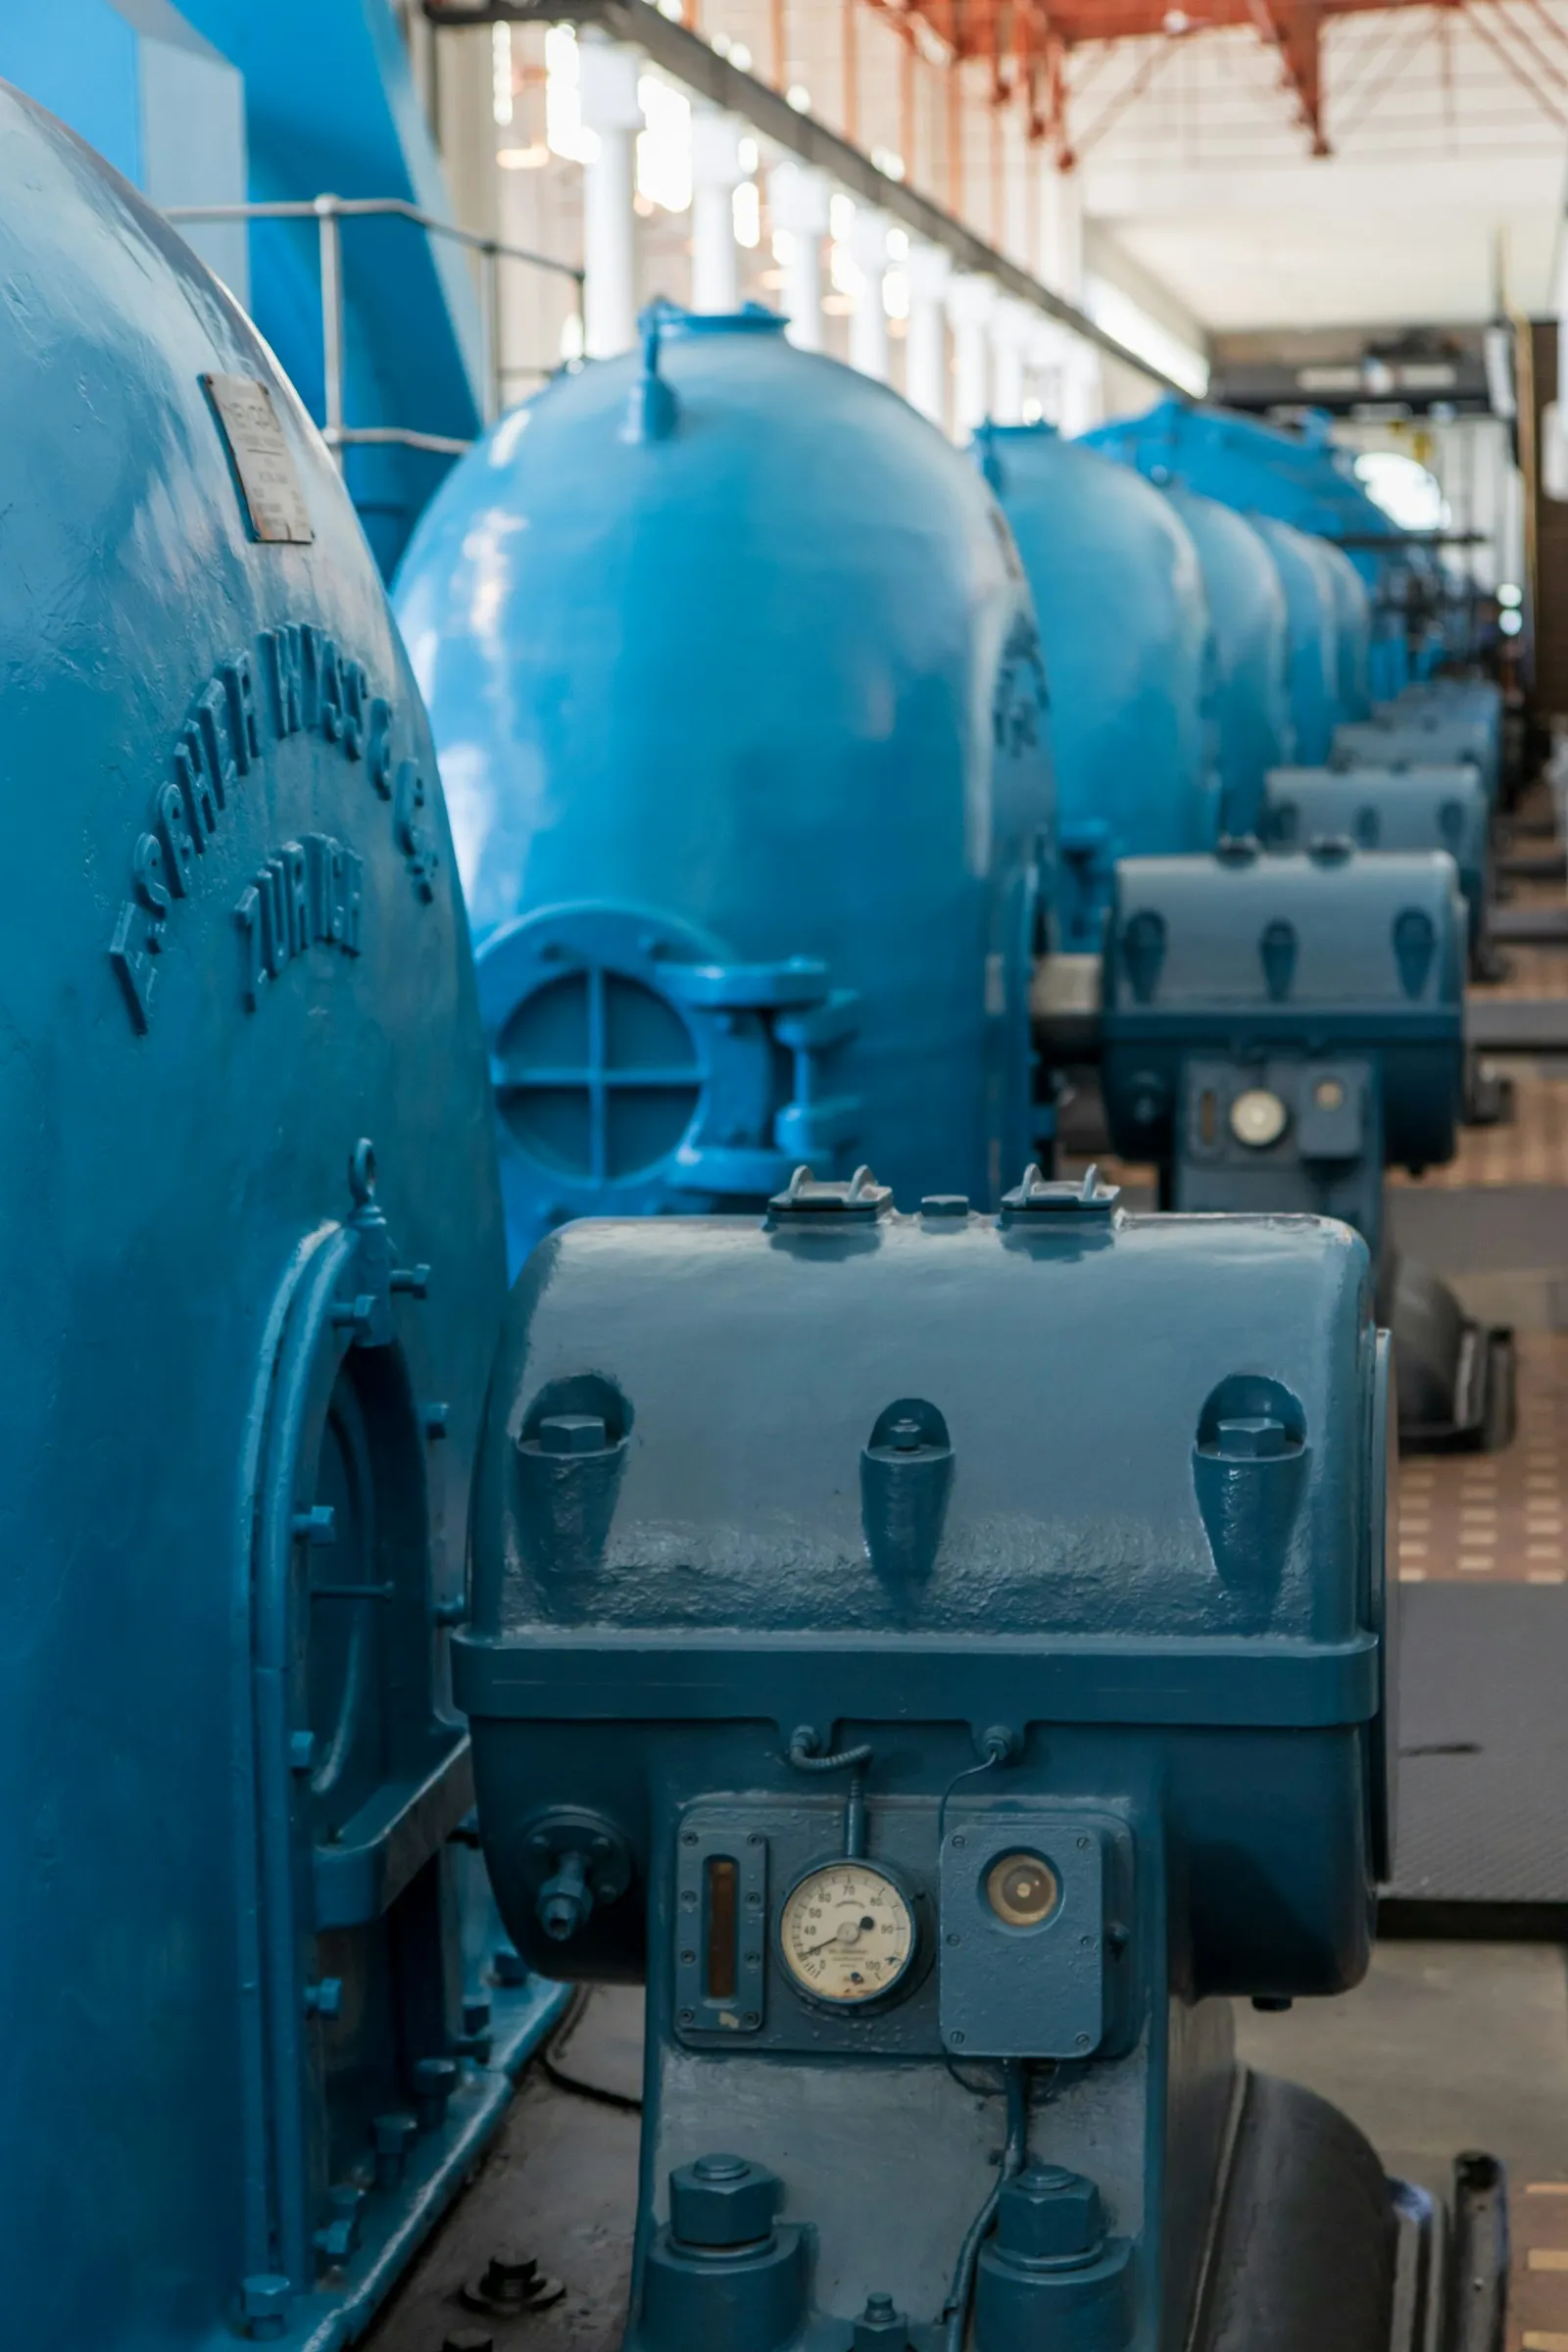
01 · Context
Membranes that foul with use
A desalination plant produces water by pushing seawater through reverse osmosis membranes grouped in trains. Over time the membranes foul and must be chemically cleaned, taking part of the operation offline. The module was built within an industrial monitoring SaaS platform.
02 · Problem
Cleaning too late or too early both cost
Clean too late and the system works harder and uses more energy. Clean too early and chemicals and operating hours are wasted. And plant signals, with their gaps and outliers, hide the trend.
03 · Approach and method
From noisy signals to a suggested date
- 1Build an index
Operating signals are combined into a health index that is comparable over time.
- 2Baseline
Each cleaning sets a new starting point for the cycle.
- 3Filter outliers
Anomalous values and gaps are excluded from the fit.
- 4Project
A regression estimates when the index will cross the threshold, with its uncertainty.
04 · Interactive demo
Try the monitor
A conceptual reconstruction of the module: zoom the time window and move the threshold to see how the suggested date, alerts and scenario versus a fixed schedule change.
05 · Results
What was observed on site
Real results · no figures for confidentiality- Decrease: Lower specific energy consumption
- Decrease: Lower total energy consumption
- Increase: Higher flow after cleaning
Observed on one train during a 6-month on-site validation. The module contributed alongside other operational improvements: results are not attributed to it alone.
06 · My contribution
I took part in every stage
- 01Technical workUnderstand
- Understanding the operational and business problem.
- 02Design
- Proof-of-concept design.
- Module specifications.
- 03Build
- Data integration.
- Code for the index and threshold-projection formulas.
- 04Management and handoverManage
- Task backlog and prioritization.
- Task specification for the team.
- 05Validate and hand over
- Audit of the on-site validation.
- Handover to operations teams.
07 · Technologies
Tools
Model and analysis
Platform (team stack)